We’re happy to announce coworking analytics, now available to our coworking clients and accessible anytime within your venue dashboard! Actions completed by you within your venue dashboard and by your users within your venue’s mobile app are collected and summarized in a series of graphs and key metrics, nestled into the corresponding tabs within your venue dashboard. These analytics offer you valuable snapshots of how your business is performing across a number of key variables.
There are endless uses for these coworking analytics. Set specific, measurable business goals and then track your progress. Gather quantifiable data to present to prospective business partners to explain why your coworking space is a viable business model capable of expanding to multiple locations. Monitor your revenue stream and immediately pinpoint your greatest areas of opportunity. The possibilities are endless.
Curious what you’ll find in these analytics, and how they’ll help you optimize your business? Below, we’ll walk you through what types of information are available to you in each of the four new analytics tabs: Bookings, Users, Plans, and Invoices.
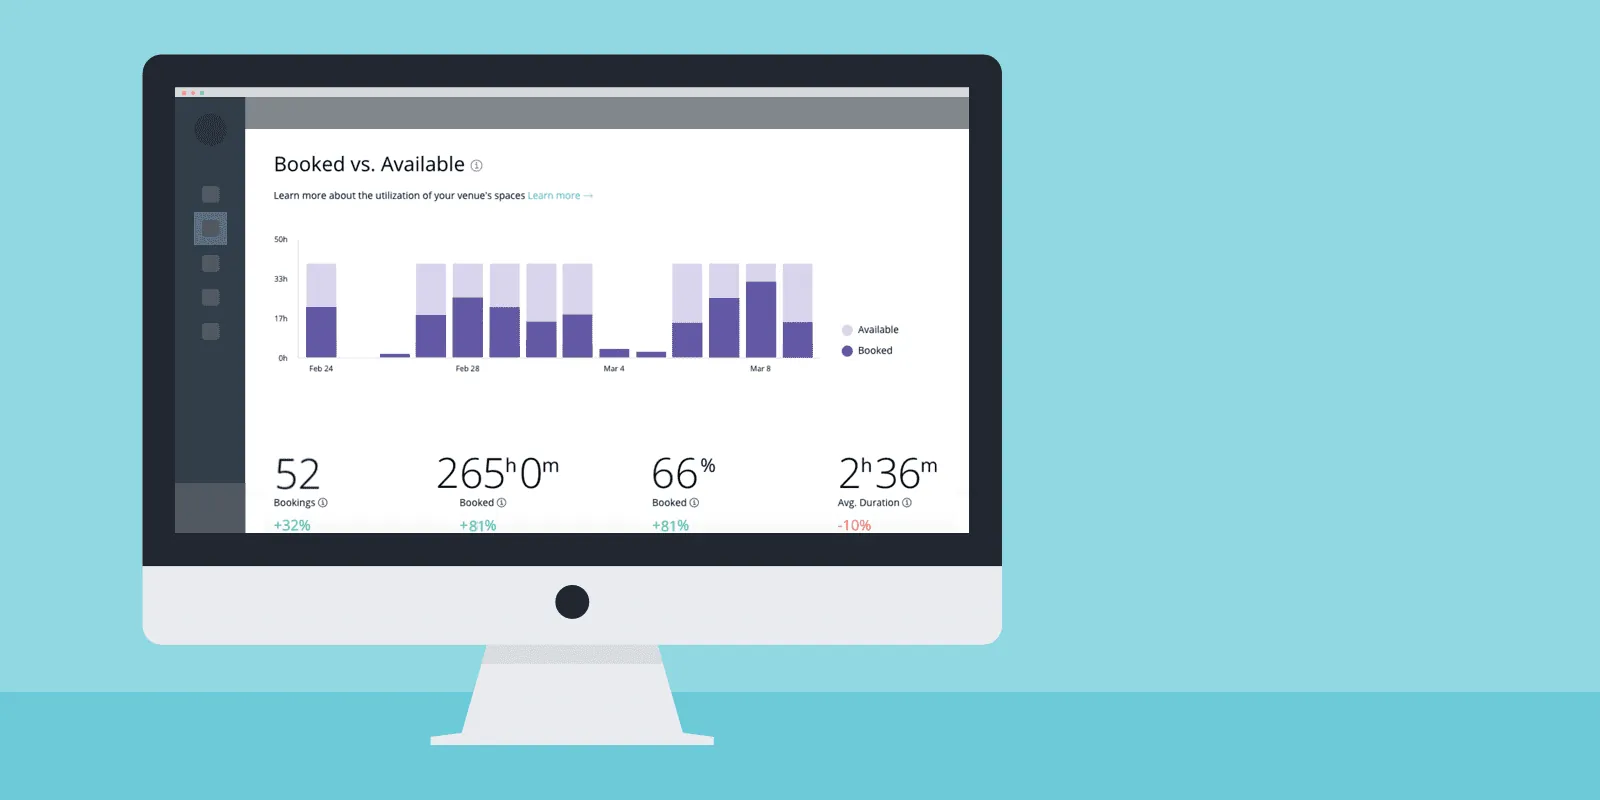
Booking analytics: Learn more about your venue is being used
Booking analytics give you a window into understanding the utilization of your venue’s shared spaces. See your venue from both a bird’s eye perspective to track overall performance. Dive a little deeper to investigate at a more granular level. The booking analytics will lead you uncover that underperforming meeting room that nobody seems to be reserving, and the desk the seems to be everyone’s favorite. These insights will allow you to identify patterns, uncover areas of opportunity, and also ultimately help drive your decisions and lead you to uncover areas of opportunity.
With booking analytics, you’ll be able to understand the total time your spaces were booked vs. time those spaces were available and sat empty, in addition to key KPIs by each individual space. It’s never been easier to track the success of your efforts to make the most of your venue’s shared spaces.
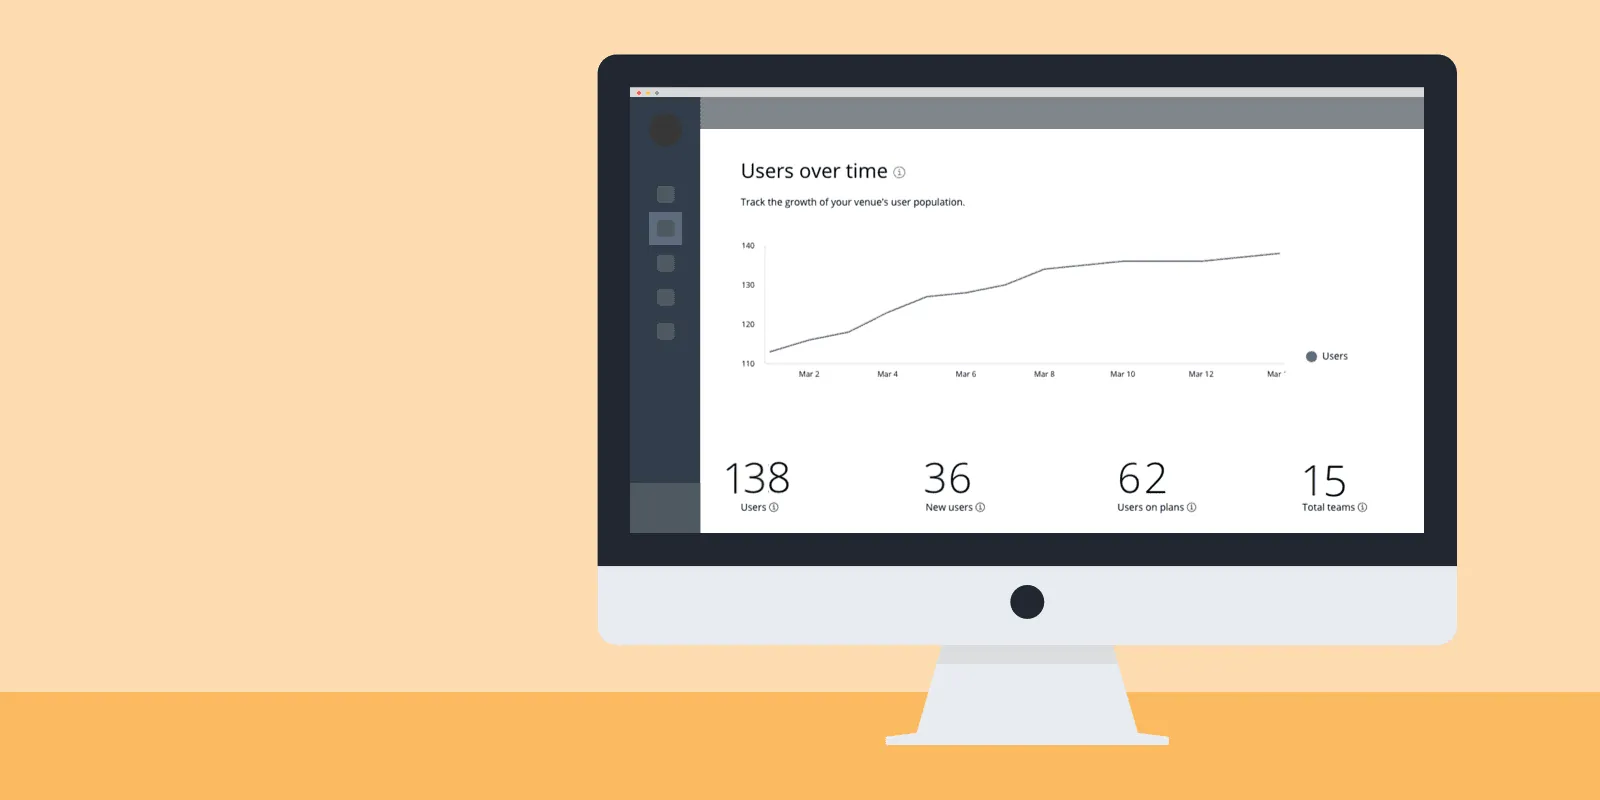
User analytics: Monitor your growing user population
Looking to grow your community? Every member counts. User analytics is where you’ll be able to track the ebb and flow of your user base. Adjust the sliding date range to see the growth of your users, and also see how many new users you added to your Optix account in a given time frame. Finally, understand the numbers of users on plans and work towards building your membership base.
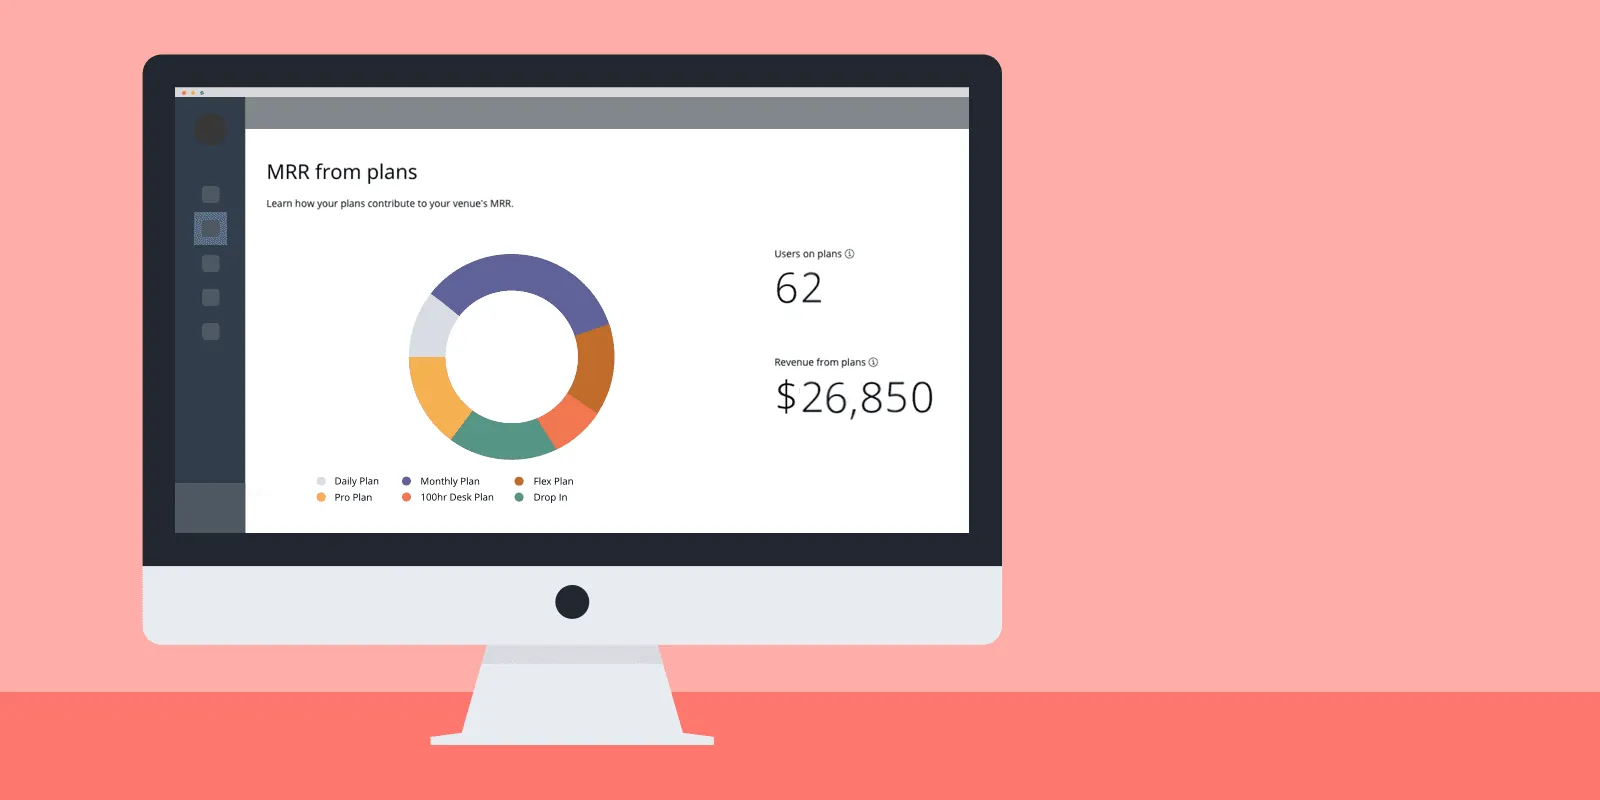
Plan analytics: Break down your venue’s MRR from plans
Track your coworking venue’s total MRR and understand which of your plans are performing well by accessing a breakdown of your MRR by plan type with Plan analytics. Understand how many users on your Optix account are currently assigned to a plan, and the total MRR generated from those users. In addition, you’ll also be able to see an overview of how each individual plan contributes to your MRR in list form, including how many users are on a given plan and the plan’s monthly revenue.
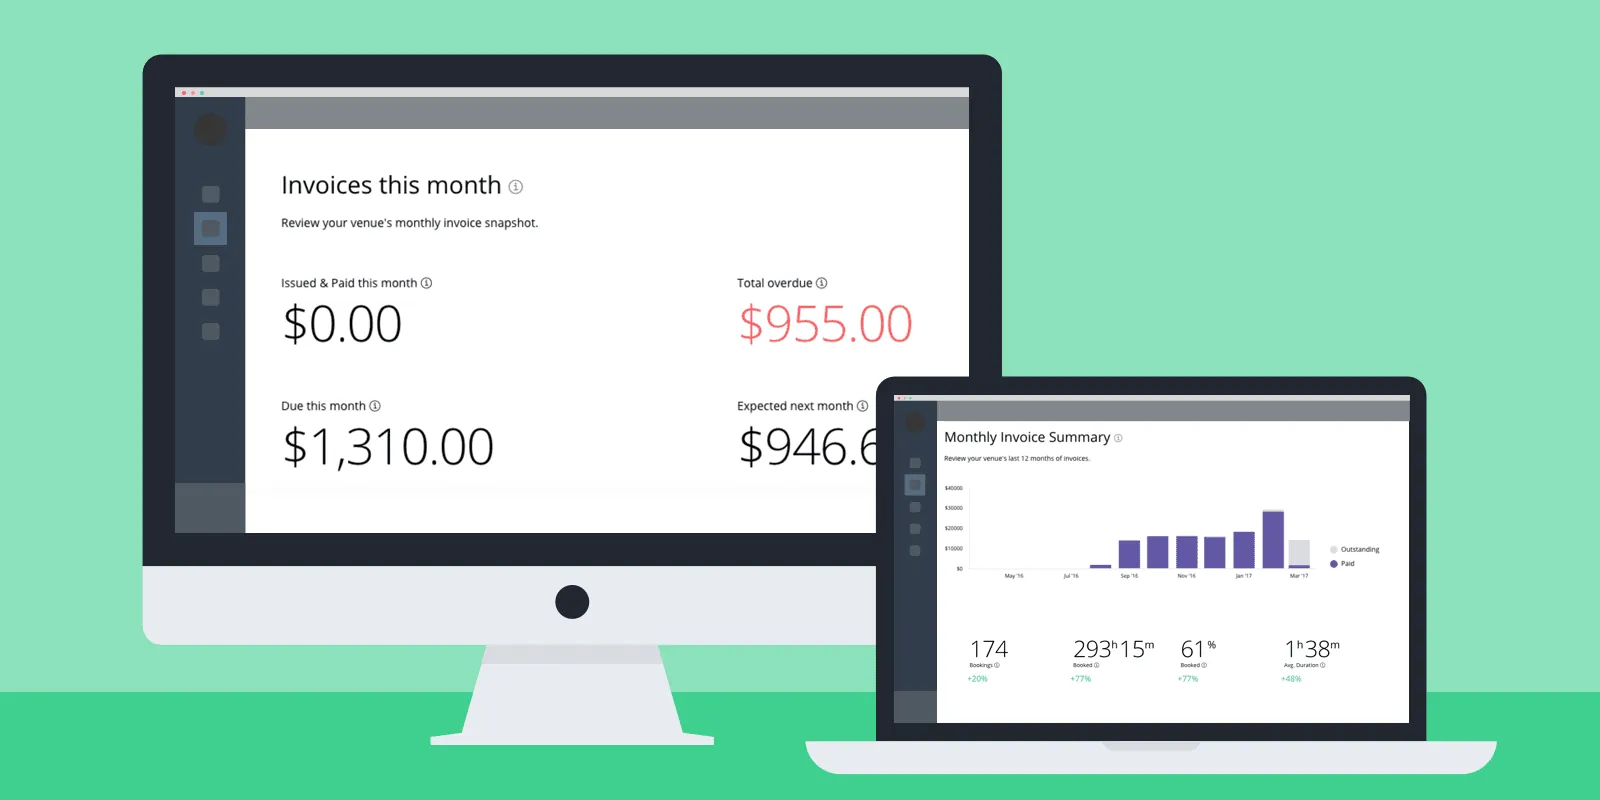
Invoice analytics: Review a year’s worth of invoices at a glance
Within your Invoice analytics, you’ll see up to twelve months of historical revenue, summarized in a graph. Here, you’ll be able to track your venue’s overall performance from a revenue perspective. Furthermore, hover over a column to view the number of invoices (and total balance) which your members have paid, and corresponding values for invoices which are currently outstanding.
Additionally, you’ll find a monthly snapshot summarizing your invoices for the current month. Key KPIs help you gain insight into: the total revenue generated from invoices, a revenue forecast for next month, and more!
With Optix coworking analytics, we hope to empower your management team with the information you’ll need to monitor the success of your coworking space, and help power your future business decisions.
Interested in learning more? Sign up for a demo here

